Please check if your browser is up to date!
Older versions of Internet Explorer are not suppoprted! Please use some other web browser!
Department of Cardiology
Heart Center
Academic Medical Center
University of Amsterdam
The Netherlands
QT Calculator
for LQTS probability calculation
Home
How to measure the QT-interval
How to use this calculator
References
HOW TO MEASURE THE QT-INTERVAL
Part of this text is adapted from Postema and Wilde, The measurement of the QT-interval, Current Cardiology Reviews 2014.
WHICH LEAD?
The QT-interval is different in different leads (as all ECG parameters are). This is caused by the varying projections on different lead vector axes. Historically, measurement of P-QRS-T-intervals is preferably performed in lead II. There are several reasons for this custom:
1. In the earliest years of the ECG there were no precordial leads and lead choice was thus confined to the limb leads.
2. The vector axis of the P, QRS and TU-wave is predominantly directed infero-lateral and thus in the direction of lead II. This often results in easily recognizable P, QRS, T and U-waves in lead II, which promotes their measurement.
3. As a consequence of the above-mentioned reasons, the reference values are also determined for lead II.
However, sometimes the end of the T-wave can not be easily determined in lead II, and alternatively lead V5, V6 or I can be used.
HOW MANY COMPLEXES?
The QT-interval you use to enter in the calculator should preferably be determined from the average of 3 consecutive beats.
WHAT ABOUT THE U-WAVE?
The QT-interval implies that the U-wave should not be included in the measurement, as one would then need to determine the QU-interval. However, it is clear that cardiac repolarization is only finished after the end of the U-wave. But as the U-wave is often suppressed by standard ECG filtering or suppressed by the P-wave at faster heart rates, it is often not well recognized on a standard 10 second ECG. Therefore, it is common practice to measure the QT-interval instead of the QU-interval as a measure of the duration of cardiac repolarization. In fact, there are also no accepted reference values for the QU-interval while often dedicated electrocardiographic techniques are needed before one can really focus on the U-wave. When the U-wave is meticulously studied, it has a duration of 200ms to 350ms and inclusion in the QT-interval would thus result in extreme and erroneous QT values. Still, when it is accepted that the TU-wave is the reflection of a continuous process of repolarization, it is no surprise that defining the true end of the T-wave is complicated. How to handle the U-wave is shown in the figure.
END OF THE T-WAVE?
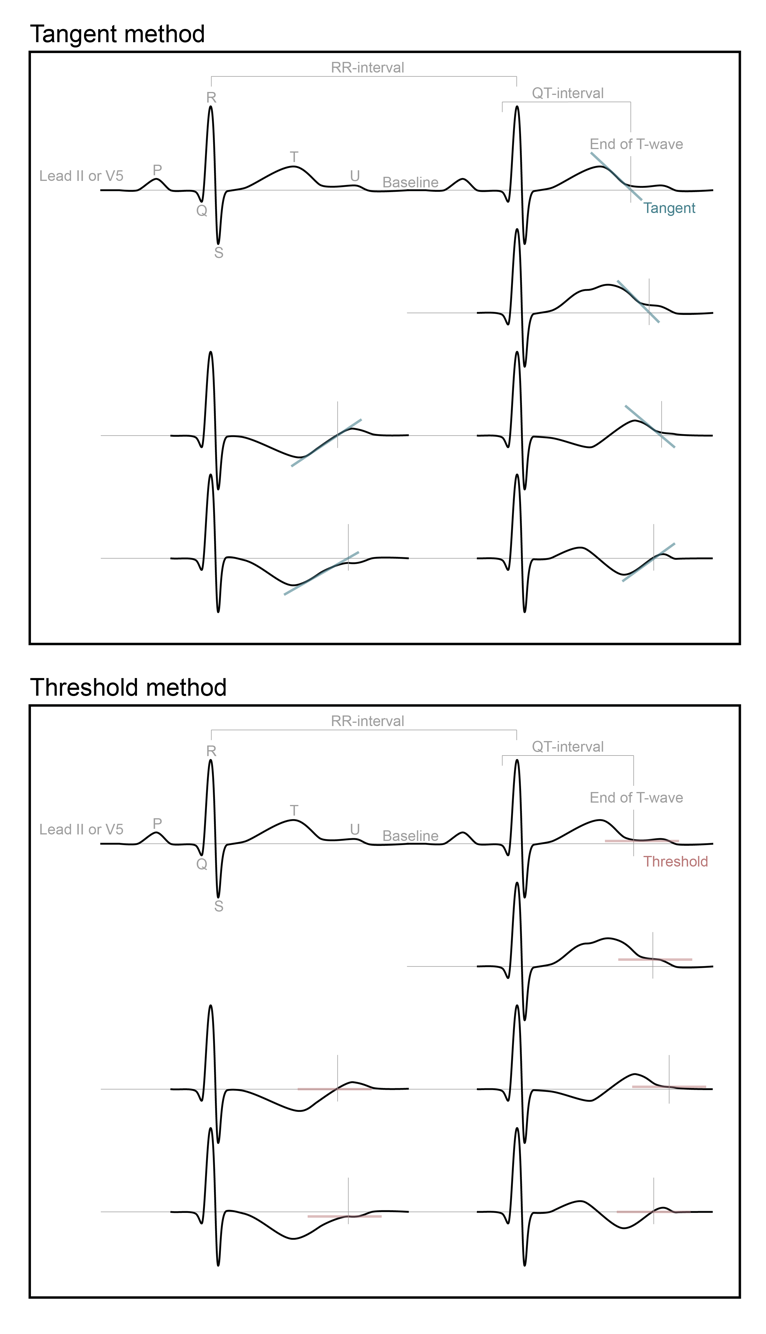
The QT-interval is measured from the onset of the QRS-complex to the end of the T-wave. When the QT-interval is measured manually, you can use either the tangent method or the threshold method to determine the end of the T-wave.
Tangent method
To determine the end of the T-wave by the tangent method, you first take the tangent on the steepest point of the terminal limb of the T-wave. There were the tangent intersects with the isoelectric baseline, is the end of the T-wave (Figure).
Threshold method
To determine the end of the T-wave by the threshold method, you take the intersection of the terminal limb of the T-wave with the isoelectric baseline (Figure). When a U-wave interrupted the T-wave before it returned to baseline, the end of the T-wave is than the nadir between the T- and U-wave.
Both manual methods for measuring the QT-interval, require the determination of the isoelectric baseline:
Isoelectric baseline
The isoelectric baseline can be obtained by connecting the TP-segment (the segment between T-wave and P-wave) of the complex in which you measured the QT-interval, with the TP-segment of the preceding complex (Figure).
CORRECTION FOR HEART RATE
The QT-interval is corrected for the RR-interval or heart rate. It is important that the RR-interval (or heart rate) between the measured and the preceding complex was used to obtain the QTc-interval (figure). The QT-interval can then be corrected for the RR-interval/heart rate with several correction formulas as shown in the QTcalculator.
1. Bazett: QTcB=QT/RR1/2
2. Fridericia: QTcFri=QT/RR1/3
3. Framingham: QTcFra=QT+0.154 (1−RR)
4. Rautaharju: QTcR=QT−0.185 (RR−1)+k
(k=+0.006 seconds for men and +0 seconds for women and children <12years)
5. Hodges: QTc=QT+(1,75*(HR-60))
PRESENCE OF ARRHYTHMIAS AND VENTRICULAR CONDUCTION DEFECTS
The QT-interval is preferably measured during stable sinus rhythm. However, in some occasions you are challenged with extra systoles, overt sinus arrhythmia or even atrial fibrillation. Extra systoles and the beat directly following an extra systole should preferably not be included in the measurement of the QT-interval but may provide a lot of information; those patients with decreased repolarization reserve will show aberrant QT-intervals or even giant T-U waves after the sudden change in heart rate initiated by the extra systole. In sinus arrhythmia, especially apparent in (young) children, the varying RR-intervals result in so much variation in the QTc-interval that the probability for an erroneous diagnosis of a prolonged QT-interval is increased. The QT-interval should be measured in complexes without a marked sinus arrhythmia when possible. In atrial fibrillation, the QT-interval is difficult to determine and the irregular RR-intervals/heart rate also effects the QTc-interval. Therefore, the QT-interval is preferably determined during stable sinus rhythm, while QTc-intervals values derived from ECGs with arrhythmias should be interpreted with caution.
Looking at conduction disorders, the largest problem is the influence of the QRS-duration on the QT-interval. If the QRS-complex duration is increased, it will mostly result in an increase in QT-interval. Prolonged QT-intervals in individuals with wide QRS-complex can be associated with normal repolarization or prolonged repolarization times and can therefore be non-specific. Since the QT-interval prolongs in ventricular conduction defects, an adjustment for QRS duration becomes necessary. This can be accomplished best by using the JT interval (QT-interval minus the QRS-duration), which then would need dedicated reference values (not currently available). There are several correction formulas for QT-interval assessment in bundle branch block, e.g. Bogossian et al, Heart Rhythm 2015.
Please note that the reference values used for this calculator were determined in patients without the use of QT prolonging drugs or severe hypokalemia. In the case QTc prolongation with severe hypokalemia and/or the use of QT prolonging drugs, we advise to determine the QTc again after correction of these elements.
HOW TO USE THE QTCALCULATOR
LONG QT-SYNDROME
The congenital long-QT syndrome (LQTS) is an inheritable cardiac arrhythmia disorder with a prevalence of about 1 per 2000 persons and is associated with sudden cardiac death due to malignant ventricular arrhythmias. Prolongation of the QT-interval corrected for heart rate (QTc-interval) is the hallmark of the clinical diagnosis of LQTS and it mirrors a prolonged repolarization caused by mutations in genes encoding key cardiac ion channels.
QT-INTERVAL
Despite the importance of the degree of QT-interval prolongation, no standard method for its measurement and correction for heart rate (QTc-interval) has been unequivocally established. Although the QT-interval can be assessed automatically, LQTS-experts advocate manual measurements using either the tangent or threshold method (See How to measure the QT-interval). However, when both methods are applied to the same ECGs, the tangent method consistently measures shorter QT-intervals than the threshold method.
VARIABLES AFFECTING THE QTC-INTERVAL
Current guidelines focus on QTc-interval cut-off values in the diagnosis of LQTS, but these cut-off values are not specific for the method used to measure the QT-interval, the correction formula used to correct the QT-interval for heart rate, age and/or sex, although age and sex are known modulating factors of the QTc-interval.
AIM AND USE OF THE QTCALCULATOR
Aim
In this calculator you can enter your measured QT-interval, RR-interval or heart rate, the method you used for the QT-interval measurement (tangent or threshold method), as well as the age and sex of your patient. The calculator will then provide you the QTc-intervals for five established correction formulas (i.e. Bazett, Friderica, Framingham, Hodges and Rautaharju). Based on the correction formula you wish to use the calculator will provide you the probability of LQTS for this specific patient with this specific measured QT-interval.
Use
To be able to use the QTcalculator properly, you have to follow these steps:
1. Look at the instructions How to measure the QT-interval and measure the QT-interval of your patient with the method (tangent or threshold) you are familiar with and/or the one you prefer.
2. Look at the calculator and enter your patients’ gender and age.
3. Enter the QT-interval you measured and the preceding RR-interval or heart rate.
4. Specify which method you used to measure the QT-interval.
5. Specify which correction formula you want to use to correct the QT-interval for heart rate.
6. The calculator will provide you with the probability for LQTS.
INTERPRETATION OF THE QTCALCULATOR OUTPUT
The probability for LQTS is based on the QTc-interval percentiles of controls and LQTS-patients. The calculator gives you the percentile of the entered QT-interval for a control individual and for a LQTS-patient. For example, when your patient is a male of 35 years with a QT-interval measured by the tangent method of 430ms, and a heart rate of 50 bpm, the QTc-interval calculated with Bazett’s formula tells you that the accompanying QTc-interval of 393ms (and below) is seen in 55% of the controls and 15% of the LQTS patients. Therefore, the probability for LQTS in this patient is rather low since this specific QTc-interval calculated with Bazett’s formula is seen more often in controls as compared to LQTS-patients.
HOW THIS CALCULATOR WAS BUILD
The data for these normalized means and standard deviations, comes from a comprehensive study that was performed in patients with a confirmed pathogenic variant in KCNQ1 (LQT1), KCNH2 (LQT2) and SCN5A (LQT3) genes and their family members (link to article). LQTS-patients had type 1 (LQT1), type 2 (LQT2) or type 3 (LQT3) LQTS, and controls were genotype-negative family members. Considering the absence of included individuals from the general population in this study, the probability for LQTS given by the calculator is most relevant in a setting where your patient has a high (e.g. 50%) a priori probability for LQTS, with an intermediate or slightly prolonged QTc-interval. Hence, the data used to build the calculator provides the possibility to assess the likelihood that your individual patient has LQTS.
REFERENCES
The QTcalculator has been made available by the Academic Medical Center, University of Amsterdam, The Netherlands, Department of Cardiology, in cooperation with the Cardionetworks Foundation (www.cardionetworks.org).
The QTcalcultor is part of the following paper in Circulation:
Determination and Interpretation of the QT-interval: Comprehensive Analysis of a Large Cohort of Long QT-syndrome Patients and Controls. Circulation. 2018. DOI: 10.1161/CIRCULATIONAHA.118.033943.
The authors are:
• A.S. Vink, MD, MSc(EBP)1,2*
• B. Neumann, MD3
• K.V.V. Lieve, MD1*
• M.F. Sinner, MD, MPH3,6
• N. Hofman, PhD1*
• S. el Kadi, BSc1
• M.H.A. Schoenmaker, BSc1
• H.M.J. Slaghekke, BSc1
• J.S.S.G. de Jong, MD, PhD4
• S.A.B. Clur, MBBCh, MSc(Med), FCP(SA)Paed, PhD2
• N.A. Blom, MD, PhD2,5*
• S. Kääb, MD, PhD3,7
• A.A.M. Wilde, MD, PhD1,6*
• P.G. Postema, MD, PhD1
Affiliations of the authors
1. Department of Clinical and Experimental Cardiology, Heart Center, Academic Medical Center, Amsterdam, The Netherlands
2. Department of Pediatric Cardiology, Emma Children’s Hospital, Academic Medical Center, Amsterdam, The Netherlands
3. Department of Medicine I, University Hospital Munich, Ludwig-Maximilians University, Munich, Germany
4. Department of Cardiology, OLVG, Amsterdam, The Netherlands
5. Department of Pediatric Cardiology, Leiden University Medical Center, Leiden, The Netherlands.
6. Princess Al-Jawhara Al-Brahim Center of Excellence in Research of Hereditary Disorders, Jeddah, Kingdom of Saudi Arabia.
7. German Cardiovascular Research Center (DZHK), partner site: Munich Heart Alliance, Munich, Germany
*Member of the European Reference Network for rare, low prevalence and complex diseases of the heart - ERN GUARD-Heart
REFERENCE PAPERS FOR THE QTCALCULATOR
1. Circulation paper (link)
2. Postema PG and Wilde AA. The measurement of the QT interval. Current cardiology reviews. 2014;10:287-294. (PMID: 24827793)
3. Goldenberg I, Moss AJ and Zareba W. QT interval: how to measure it and what is "normal". Journal of cardiovascular electrophysiology. 2006;17:333-336. (PMID 16643414)
4. Viskin S. The QT interval: too long, too short or just right. Heart Rhythm. 2009;6:711-715. (PMID: 19389656)
5. Viskin S, Rosovski U, Sands AJ, Chen E, Kistler PM, Kalman JM, Rodriguez Chavez L, Iturralde Torres P, Cruz FF, Centurion OA, Fujiki A, Maury P, Chen X, Krahn AD, Roithinger F, Zhang L, Vincent GM and Zeltser D. Inaccurate electrocardiographic interpretation of long QT: the majority of physicians cannot recognize a long QT when they see one. Heart rhythm. 2005;2:569-574. (PMID: 15922261)
6. Postema PG, De Jong JS, Van der Bilt IA and Wilde AA. Accurate electrocardiographic assessment of the QT interval: teach the tangent. Heart rhythm. 2008;5:1015-1018. (PMID: 18598957)
7. Taggart NW, Haglund CM, Tester DJ and Ackerman MJ. Diagnostic miscues in congenital long-QT syndrome. Circulation. 2007;115:2613-2620. (PMID: 17502575)
LQTS probability calculation
Occurrence in control subjects
Occurrence in LQTS patients
In reference control subjects XX.xx% of QTc values are below this level while XX.xx % are above this QTc
In reference LQTS patients XX.xx % of QTc values are below this level while XX.xx% are above this QTc